


Why a Refinery KPI Deviation Takes Time to Explain
A refinery performance review often begins with a familiar question: why did actual results differ what was planned? The production report shows the deviation. The process historian holds the operating conditions. Laboratory results are maintained in a separate system, while the planning team works with its own assumptions and calculations.
Before anyone can investigate the cause, someone has to bring those pieces together.
This is where oil and gas data analytics becomes useful. Bringing together operational data, quality results, and planning information helps teams better understand and explain refinery performance. The challenge is making sure those sources describe the same equipment, operating period, and business measure.
A dashboard can show that a KPI has moved outside its expected range. Understanding why requires context: what changed in the process, whether the information is reliable, and which factors deserve further investigation.
As part of downstream digital transformation, connected analytics brings that context into the performance review. Its value becomes visible when teams spend less time assembling information and more time evaluating what it means.
Where Refinery Data Loses Its Context
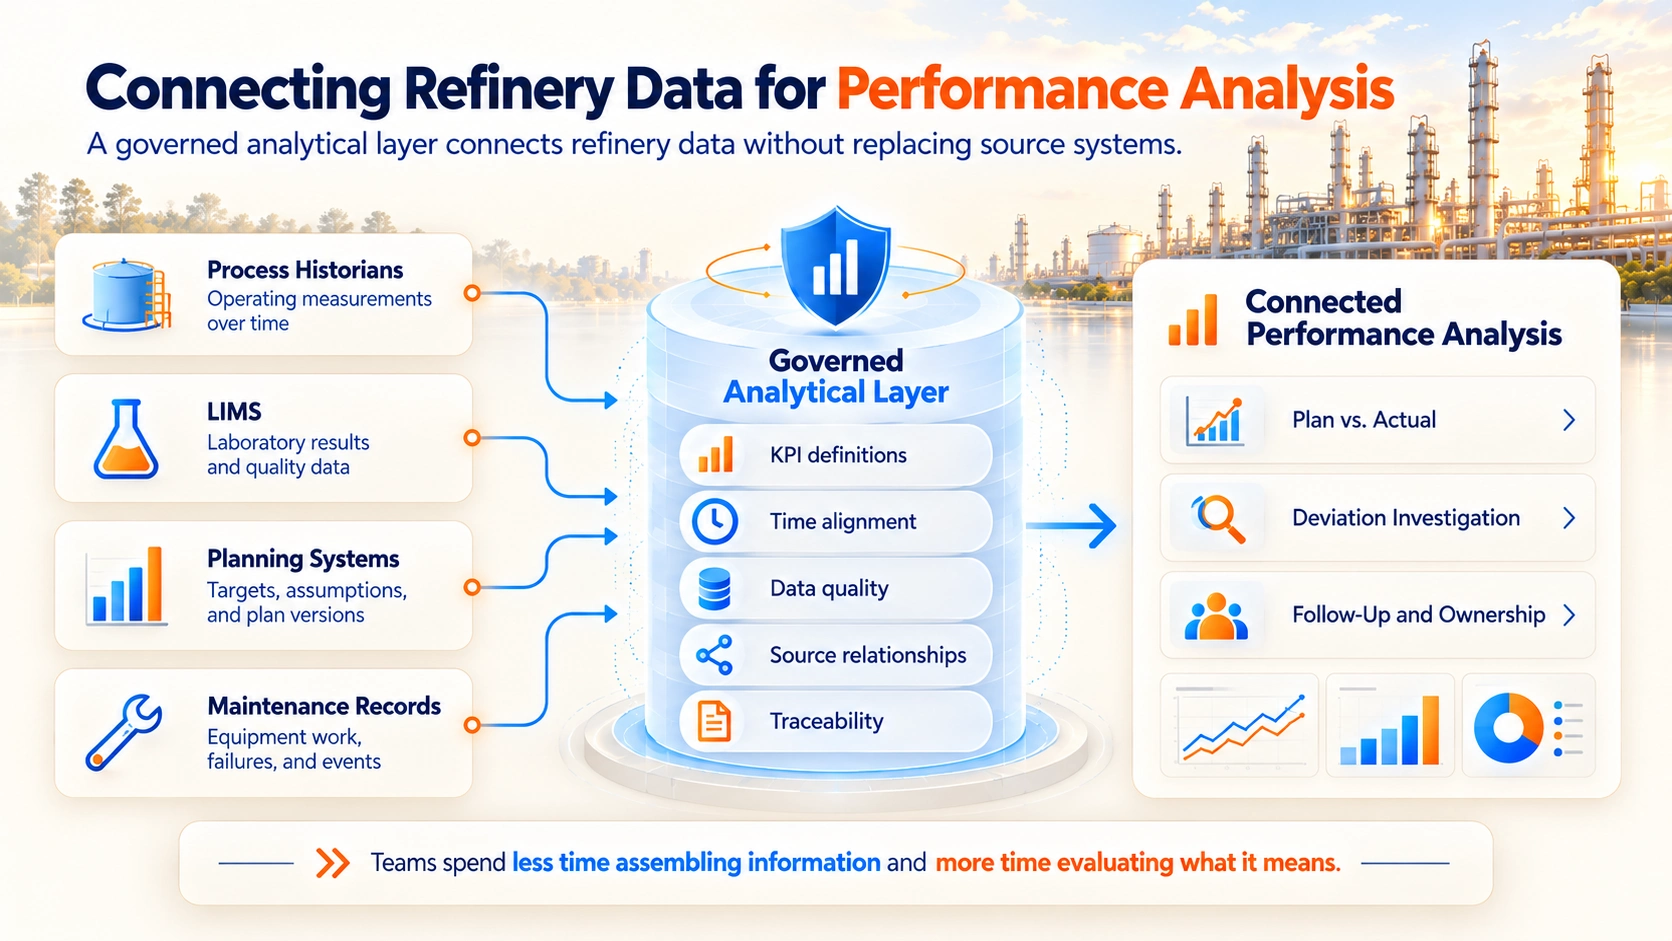
A refinery investigation often crosses several systems before it reaches an explanation. Process historians record operating measurements over time. A laboratory information management system (LIMS) holds sample results. Planning applications contain targets and assumptions, while maintenance records document equipment work and failures.
Having access to these records is only part of the challenge. Analysts must establish how each record relates to the performance question.
Repeated data preparation: An engineer may rebuild the same set of exports whenever a deviation recurs. Historian trends, laboratory results, and planning spreadsheets need to be assembled before the investigation can begin.
Different comparison bases: A daily operating result and a monthly target need a compatible reporting period, units, and calculation basis. Teams should also identify the approved plan version and check whether its assumptions still apply.
Inconsistent KPI definitions: Two utilization reports can produce different results if they treat downtime differently. Energy-intensity figures can also vary depending on how they are calculated and which operating boundaries are considered. These differences need to be resolved before interpreting performance.
Misaligned timestamps: A laboratory result belongs to the material and sampling period it represents. Its release time may be several hours later. Connecting it to process conditions requires the sampling context and, where relevant, process residence time.
Unclear data quality: A missing reading or questionable instrument value can distort a KPI. The investigation should make those limitations visible so that a measurement problem is not mistaken for an operating problem.
Incomplete follow-up: Identifying a possible explanation does not close the issue. Teams need to record what remains uncertain, who owns the next action, and how the outcome will be reviewed.
Effective oil and gas analytics helps establish clear connections between these data points, giving engineers a consistent basis for investigating performance deviations.
What Makes Refinery Performance Data Comparable?
A single source of truth gives teams an agreed basis for evaluating performance. It does not require every source system to be replaced by one database. Historians, LIMS, and planning applications can retain their roles while a governed analytical layer connects the information needed for a specific decision.
| Dimension | Disconnected analysis | Connected refinery analytics |
| Data access | Engineers gather exports from separate systems for each investigation. | Relevant sources are available through a consistent analytical view. |
| KPI definitions | Teams apply different formulas, boundaries, or exclusions. | Definitions, calculation rules, and ownership are documented. |
| Time alignment | Operational measurements, laboratory results, and planning data may be compared without aligning their respective time periods. | Information is aligned to the operating period relevant to the question. |
| Data quality | Missing or questionable values are difficult to distinguish from genuine deviations. | Quality checks and exceptions remain visible during analysis. |
| Plan vs actual | A variance is reported with limited context. | Teams can examine the variance alongside relevant operating parameters and assumptions. |
| Investigation and follow-up | Findings remain in reports, emails, or individual spreadsheets. | Evidence, investigation status, and follow-up ownership are recorded. |
The objective is traceability. Users should be able to see where a measure came from, how it was calculated, and whether limitations affect its interpretation. Confidence grows when a result can be examined and explained.
Investigating an Energy-Intensity Deviation
To understand how data analytics adds value in the oil and gas industry, consider a common refinery performance challenge.
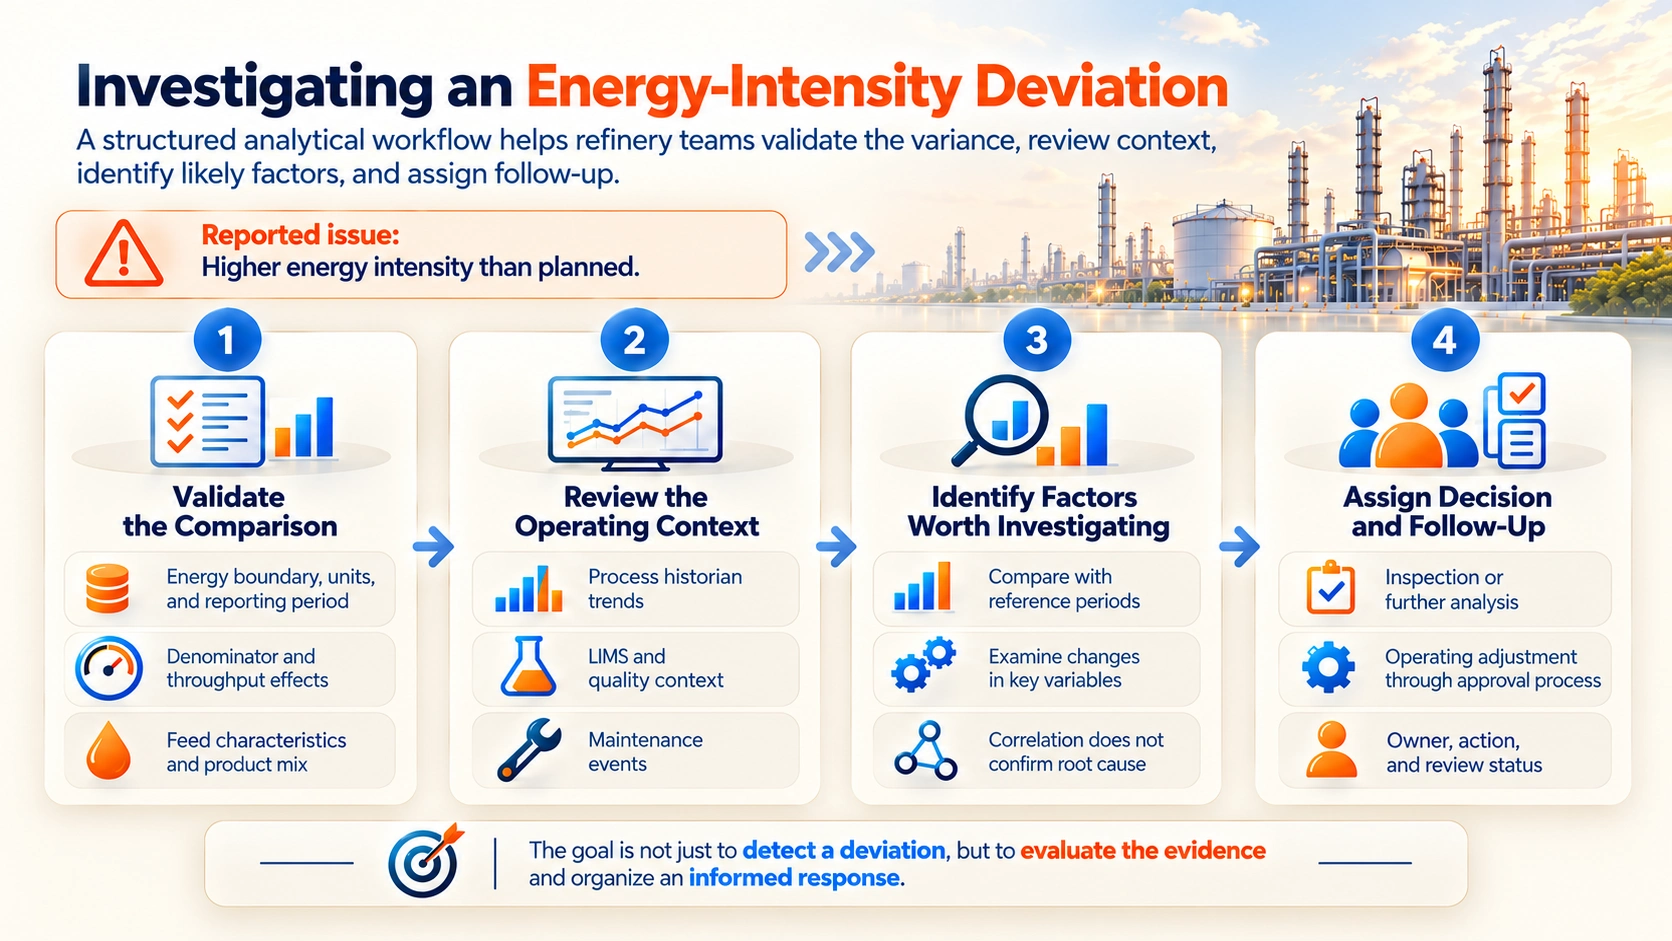
Consider an illustrative situation: a refinery unit reports higher energy intensity than planned. Teams can see where performance differed from the plan, but understanding why is still a challenge.
Establish Whether the Comparison Is Valid
First, confirm that planned and actual energy intensity use the same energy boundary, units, reporting period, and denominator. Lower throughput can increase energy per unit of output even when total energy use falls. Feed characteristics and product mix may also affect the comparison, so a variance does not automatically indicate deteriorating equipment performance.
Examine the Operating Context
Relevant process historian data can show how operating conditions changed during the period. LIMS results can add quality or feed-property context where applicable. Maintenance records may identify equipment events that deserve attention.
The aim is to assemble the evidence relevant to this deviation, rather than retrieve every available data point.
Identify Factors Worth Investigating
Analysts and engineers can examine changes in key variables by comparing the affected period with relevant reference periods. These relationships can narrow the investigation, but a correlation alone does not establish a root cause.
Process knowledge remains necessary to evaluate whether a proposed explanation is credible.
Record the Decision and Follow-Up
Once the team has reviewed the evidence, it can assign an inspection, request further analysis, or assess an operating adjustment through the appropriate approval process. Recording the finding and its owner makes it easier to follow the issue across shifts.
This is the practical role of operational analytics services: connecting performance measures with the analysis and workflows needed to investigate them.
What to Define Before Connecting the Data
A focused application of data analytics in the petroleum industry begins with agreement on the performance question and the evidence needed to answer it. Before connecting additional systems, define five things.
The measure and its owner: Record the KPI formula, units, operating boundary, and person accountable for interpreting it. Specify how downtime, missing values, and other exceptions affect the calculation.
The comparison basis: Identify the approved plan version and the period being evaluated. Document any adjustments needed to make planned and actual results comparable.
The relationship between sources: Establish how historian tags, laboratory samples, equipment records, and planning references relate to the same unit or material stream. Similar names do not always mean identical scope.
The handling of incomplete and uncertain data: Define how delayed laboratory results, revised measurements, and potentially unreliable readings should be presented. Users should be able to distinguish provisional results from reviewed figures.
The investigation record: Define where evidence, possible explanations, assigned actions, and closure decisions will be recorded. This preserves the reasoning when the issue passes between teams or shifts.
These requirements give data engineering services a clear implementation scope. They also give analysts a way to test whether the resulting information is suitable for the intended investigation.
How AI Is Extending Refinery Analytics
Refinery teams can use AI at different stages of an investigation, including finding relevant technical information, estimating process properties, and linking records to the equipment they relate to. Each application still depends on reliable data and engineering review.
Retrieving information for an investigation
Aramco describes using generative AI to help engineers synthesize technical information and prepare operational plans under human oversight. In refinery performance reviews, AI can help gather relevant records and prepare an initial investigation summary. Users should be able to inspect the underlying sources, while validated analytical systems remain responsible for KPI calculations.
Adding estimates where measurements are limited
Aramco also reports using soft sensors within its Operations Co-Pilot to estimate variables that cannot be measured directly. When applying this approach, label a soft-sensor estimate separately from a laboratory result or instrument reading. Engineers also need to know the model’s operating limits and whether its performance has changed.
Preserving asset relationships in analytical tools
Industrial software developments are placing more emphasis on the relationships between equipment, measurements, and engineering information. In May 2026, AVEVA announced an industrial knowledge graph planned for a Q1 2027 CONNECT release. This is an upcoming capability, rather than evidence that every refinery already has access to it.
The practical test for oil and gas analytics is whether these tools help engineers evaluate a deviation. Any move from analytical support to automated action should define the permitted actions, required approvals, and accountable operating owner.
In Practice: Connecting KPI Deviations with Follow-Up
Proclink’s published refinery root cause analysis case study describes an implementation spanning two refineries. Its scope included 49 critical KPIs, approximately 900 associated operating parameters, and at least four integrated data sources.
For this article, the useful lesson is how the investigation was organized. The implementation brought performance comparisons, examination of contributing parameters, and action assignment into one environment. It started with an MVP and expanded across the identified KPIs.
This illustrates how a performance review can continue beyond identifying a variance: the team can examine possible explanations and assign the next step within the same workflow.
Read the refinery root cause analysis case study for the implementation details and reported outcomes.
Start with One Recurring Performance Question
Choose a performance question that repeatedly requires teams to reconcile information before they can investigate it. That question provides a practical starting point for deciding which sources, definitions, and workflows need attention.
In a refinery, this could mean investigating an unexplained production variance, recurring quality issues, or changes in energy intensity. The first step is to establish a reliable foundation for understanding the problem.
Oil and gas data analytics earns its place in daily operations when teams can explain what changed, evaluate the evidence, and organize an informed response. A focused implementation gives the organization a way to test that value before extending the approach.